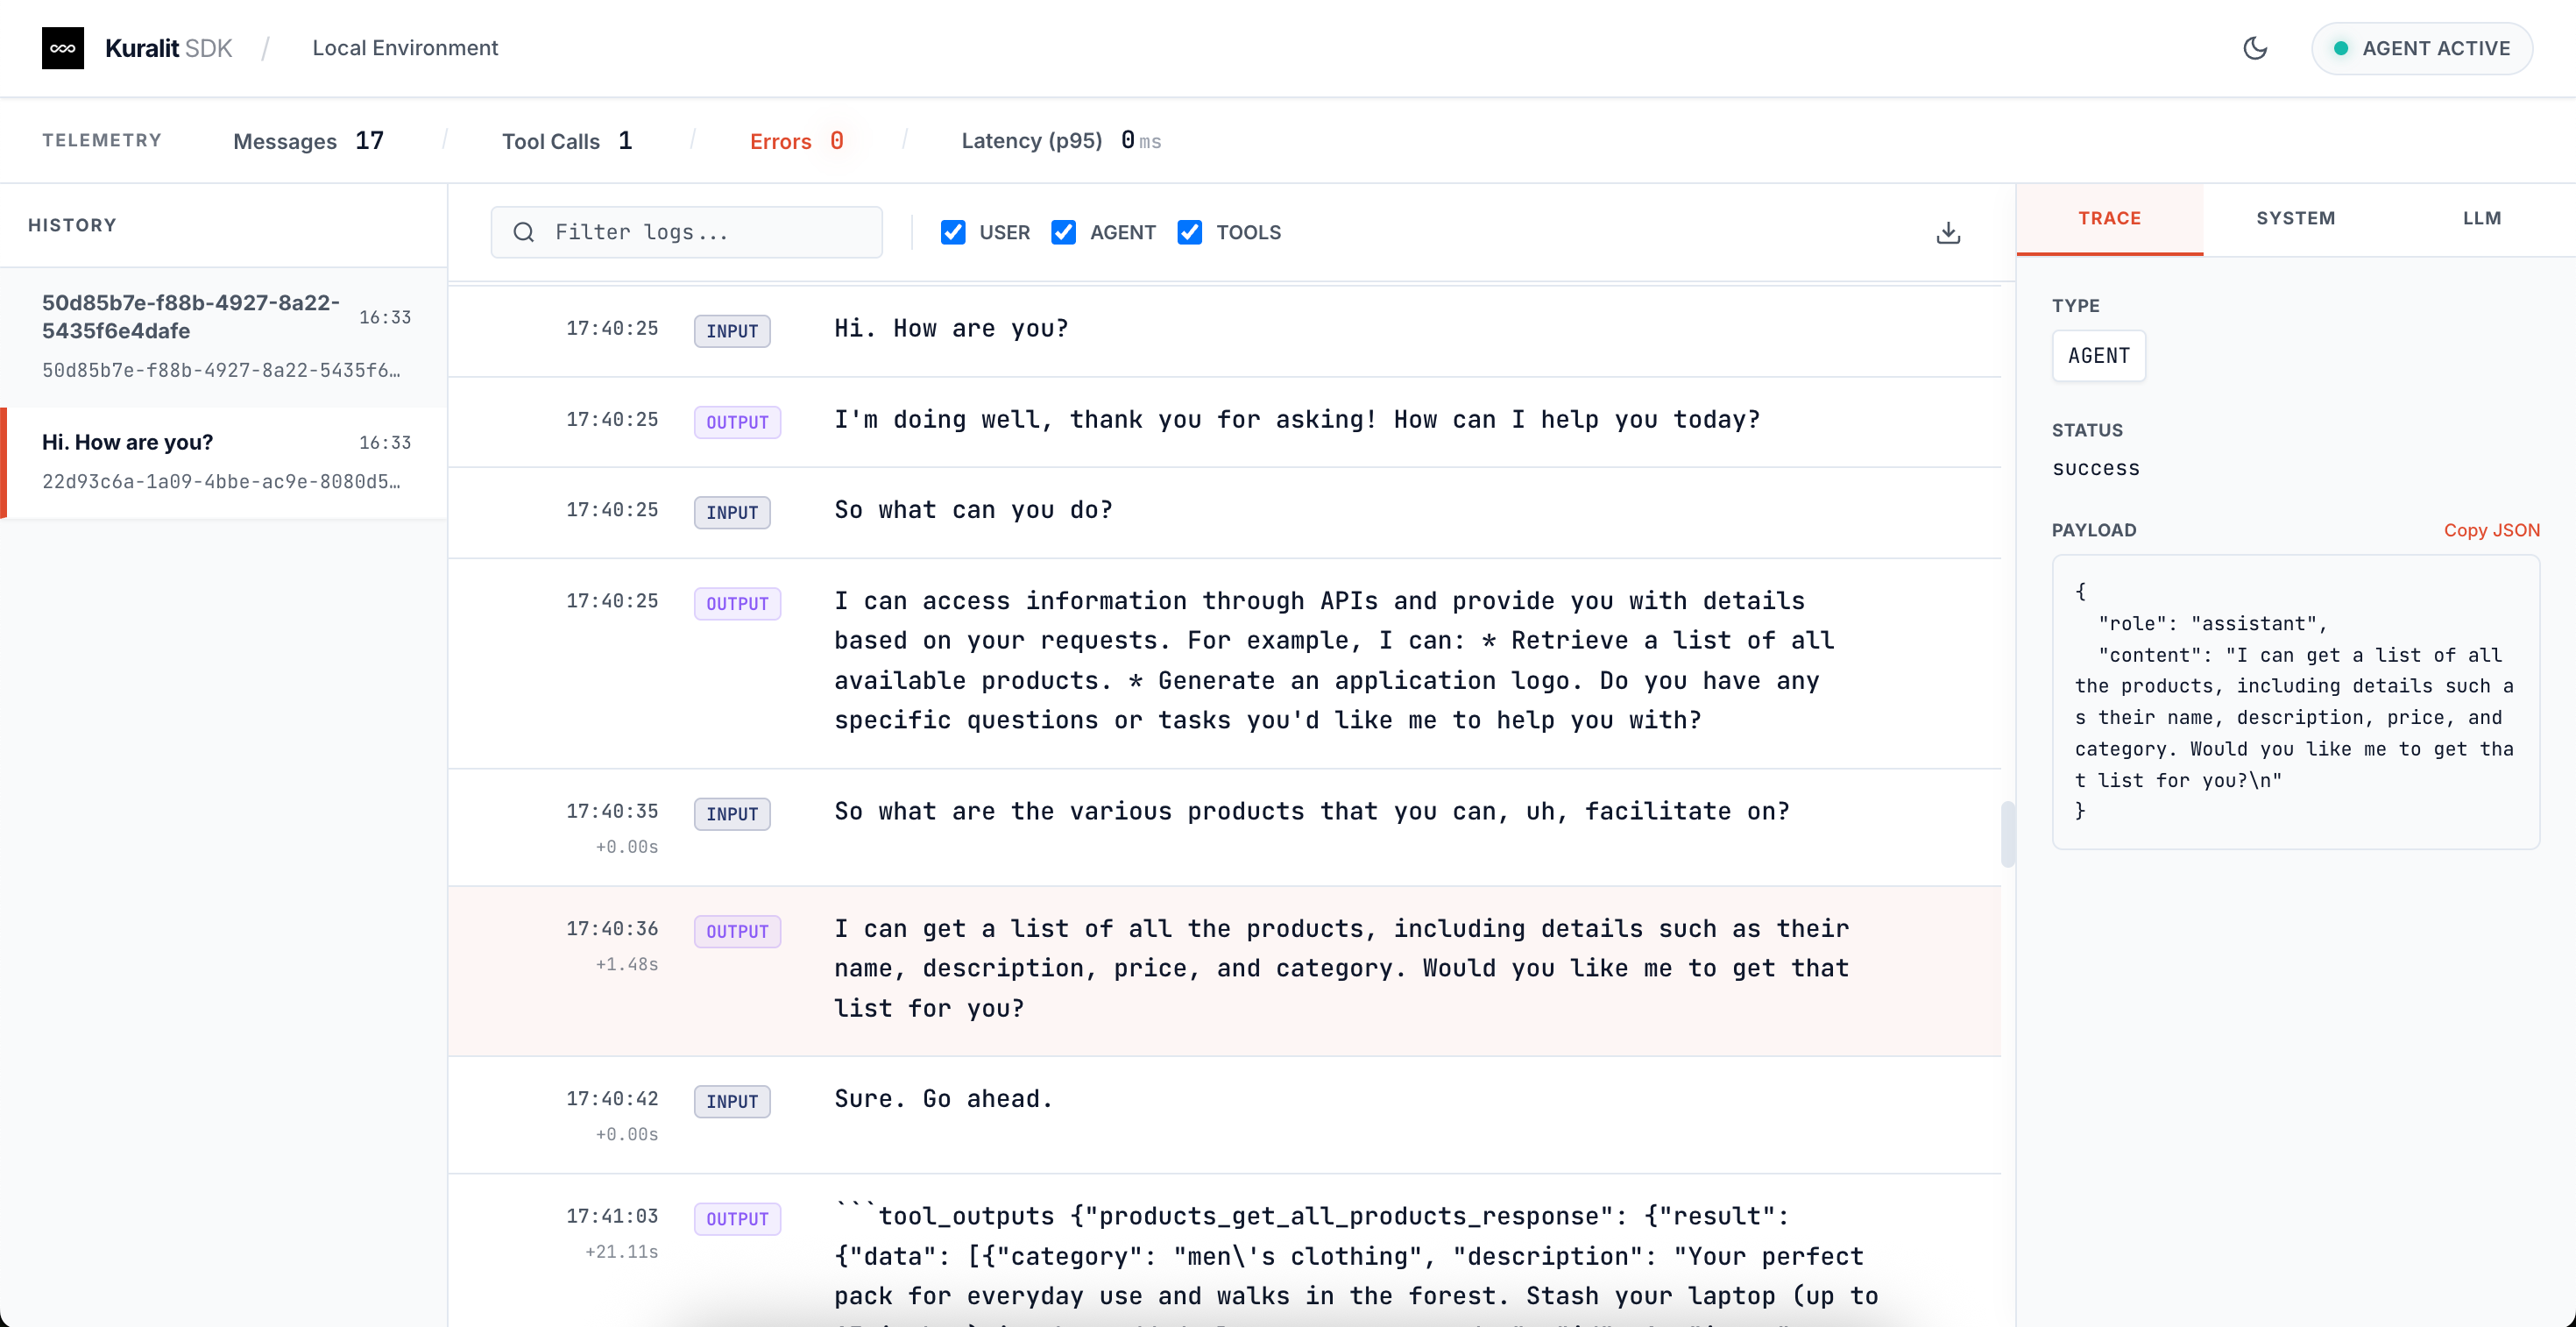
Overview
The Kuralit Dashboard connects to your Python WebSocket server via a dedicated dashboard endpoint (/ws/dashboard) and provides:
- Real-time Monitoring: Watch conversations and agent interactions as they happen
- Metrics Tracking: Monitor server-wide metrics (messages, tool calls, errors, latency)
- Debugging Tools: Inspect conversation history and agent responses
- Session Management: View and manage active conversation sessions
- Connection Status: Monitor WebSocket connection health
Note: The dashboard is an optional tool. The core SDKs work independently without it.Repository: kuralit-ui (separate repository)
Features
Real-time Monitoring
Watch conversations and agent responses as they happen, with live updates via WebSocket
Metrics Dashboard
Track server-wide metrics including messages, tool calls, errors, and latency
Debugging Tools
Inspect conversation history, view detailed event payloads, and troubleshoot issues
Session Management
View and navigate between multiple conversation sessions
Timeline View
Chronological view of all interactions with timestamps and latency information
Connection Status
Monitor WebSocket connection health and automatic reconnection
Installation
Prerequisites
- Node.js 18+ and npm
- Python Server: A running Kuralit Python WebSocket server
- Server must be running on
localhost:8000(default) or your configured URL - Server must have the dashboard endpoint enabled (automatically available with
create_app())
- Server must be running on
Step 1: Clone the Repository
Step 2: Install Dependencies
Step 3: Configure Environment Variables
Create a.env file in the kuralit-ui directory:
- Default WebSocket URL:
ws://localhost:8000/ws/dashboard(if not specified) - API Key: Optional - only required if your server enforces authentication
- Production: Use
wss://(WebSocket Secure) instead ofws://
Step 4: Start the Dashboard
http://localhost:3000 (or the port shown in the terminal).
Connecting to Your Python Server
Step 1: Start Your Python Server
First, ensure your Kuralit Python WebSocket server is running. For example:Step 2: Verify Dashboard Endpoint
The dashboard connects to the/ws/dashboard endpoint. This endpoint is automatically available when you use create_app() from kuralit.server.websocket_server:
Step 3: Configure Dashboard Connection
Option A: Using Environment Variables (Recommended)
Create a.env file in the kuralit-ui directory:
Option B: Using Default Values
If you don’t create a.env file, the dashboard will use:
- WebSocket URL:
ws://localhost:8000/ws/dashboard - API Key: None (if your server allows unauthenticated connections)
Option C: Custom Server URL
If your server is running on a different host or port:Step 4: Start the Dashboard
Usage
Connection Status
- Green “AGENT ACTIVE” indicator: Dashboard is connected to the server
- Red/Disconnected: Check that your Python server is running and the WebSocket URL is correct
Viewing Conversations
- History Panel (Left): Lists all conversation sessions with timestamps
- Timeline View (Center): Shows the conversation flow with timestamps and latency
- Details Panel (Right): Displays detailed information about selected events, including JSON payloads
Metrics
The telemetry bar shows server-wide metrics:- Messages: Total messages processed by the server (user messages + agent responses + tool messages)
- Tool Calls: Total tool invocations
- Errors: Total errors encountered
- Latency (p95): 95th percentile response latency
Filtering
Use the filter checkboxes to show/hide:- USER: User messages
- AGENT: Agent responses
- TOOLS: Tool call outputs
Event Details
Click on any event in the timeline to view:- TRACE: Event type, status, and payload
- SYSTEM: System-level information
- LLM: LLM-specific details (if applicable)
Architecture
WebSocket Connection
The dashboard connects to your Python server via WebSocket:Event Flow
- Connection: Dashboard connects to
/ws/dashboardendpoint - Initial State: Server sends current sessions, metrics, and configuration
- Real-time Events: Server publishes events via event bus:
message_received: User messagesagent_response_start: Agent response beginsagent_response_chunk: Streaming response chunksagent_response_complete: Agent response finishedtool_call_start: Tool execution beginstool_call_complete: Tool execution finishedmetrics_updated: Metrics changederror: Error occurred
- Dashboard Updates: Dashboard receives events and updates UI in real-time
Data Flow
Building for Production
dist/ directory, ready to be deployed to any static hosting service.
Troubleshooting
Dashboard Won’t Connect
-
Check Python Server: Ensure your Python server is running
-
Verify WebSocket URL: Check your
.envfile matches your server configuration -
Check API Key: If your server requires authentication, ensure the API key matches
- Browser Console: Open browser DevTools (F12) and check for WebSocket connection errors
- CORS Issues: If connecting to a remote server, ensure CORS is properly configured
No Data Showing
- Check Server Logs: Verify the server is receiving connections
- Refresh Dashboard: Try refreshing the browser
- Check Filters: Ensure USER, AGENT, and TOOLS filters are enabled
- Verify Events: Check server logs for event publications
Connection Drops
- The dashboard automatically attempts to reconnect with exponential backoff
- Check server logs for disconnection reasons
- Verify network stability
- Check if server is restarting or experiencing issues
Metrics Not Updating
- Metrics update after agent responses complete
- Verify
metrics_updatedevents are being published from server - Check browser console for event reception
- Ensure server is processing messages correctly
Related Documentation
- Sessions - Learn about session management
- Python SDK - Python server setup and configuration
- WebSocket Server - WebSocket server API reference
- Architecture - System architecture overview
Repository
- GitHub: kuralit/kuralit-ui
- Issues: Report Issues

